
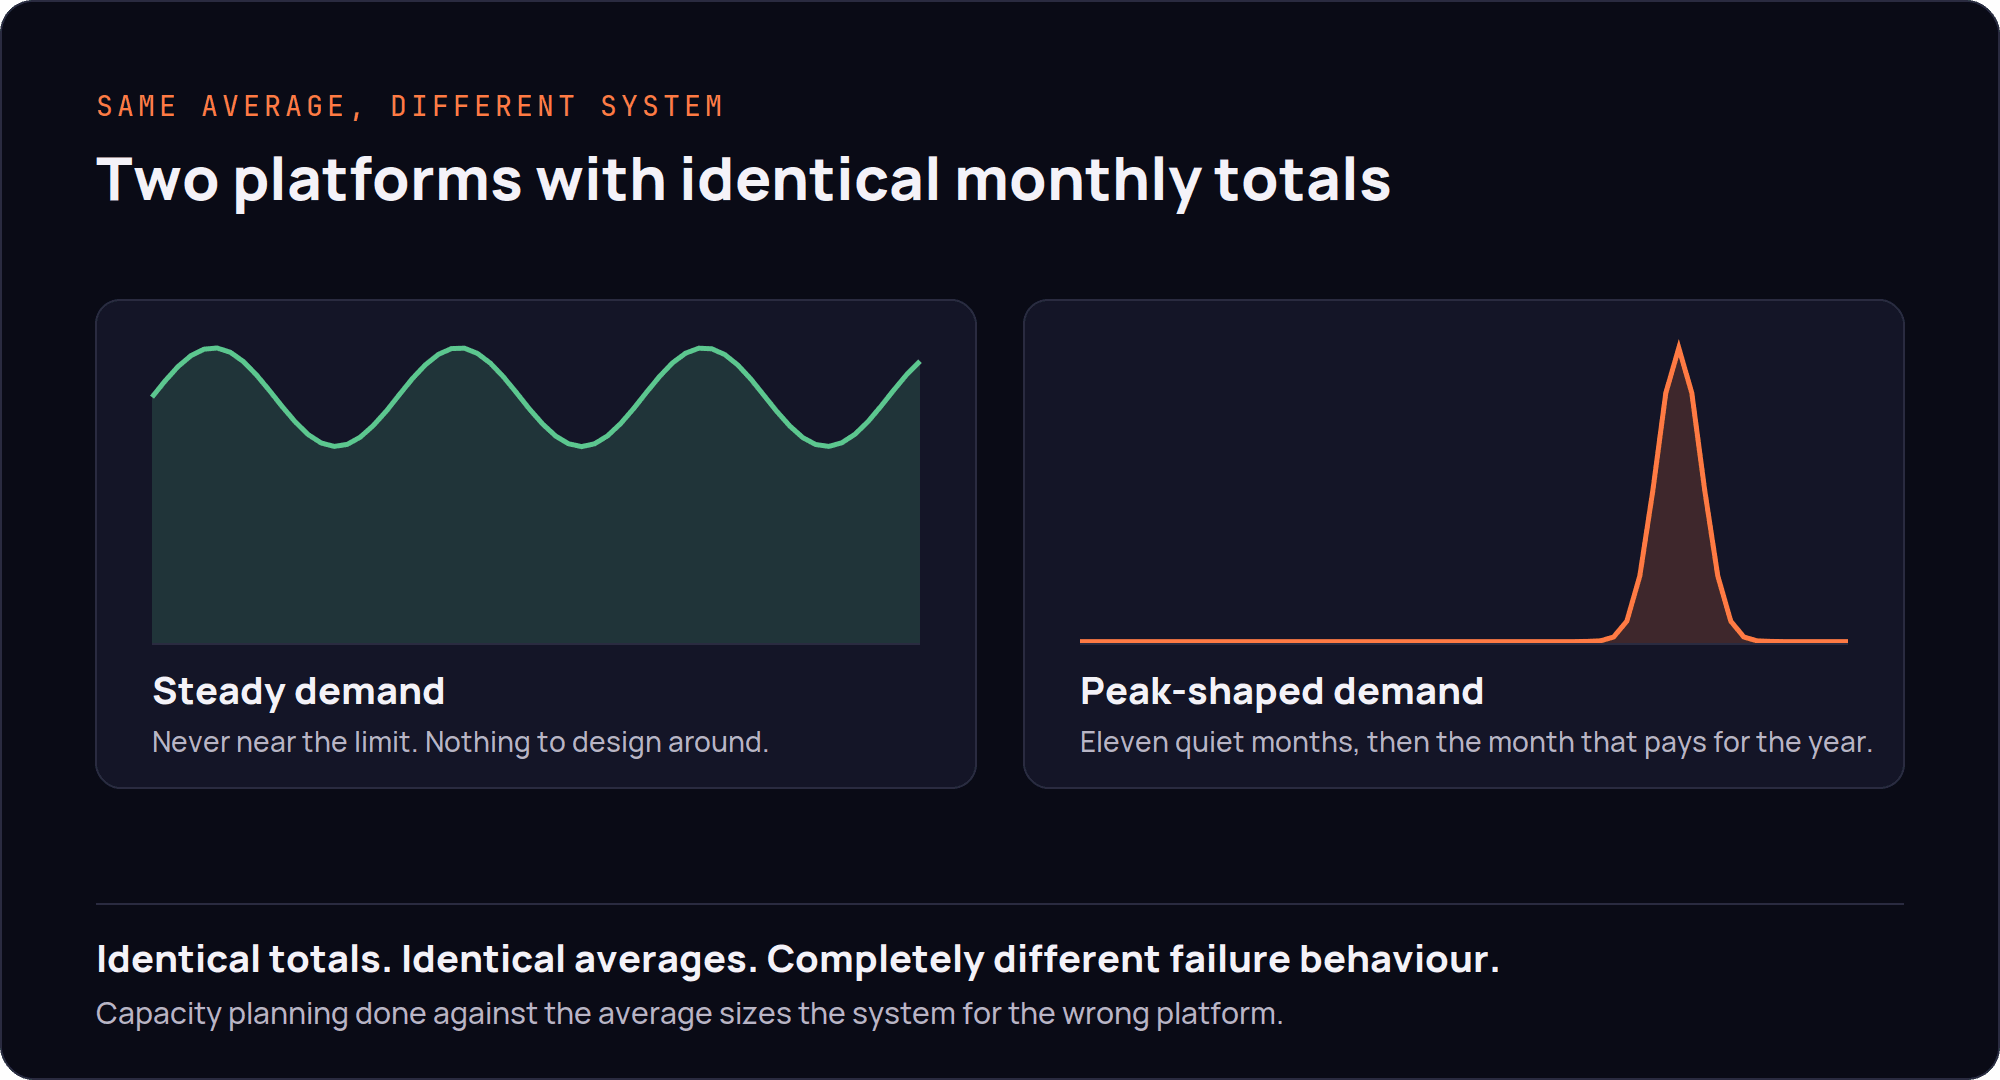
A platform serving a steady trickle and a platform serving eleven quiet months followed by three days of everything can have the same monthly average and completely different failure behaviour. What actually breaks at peak, why autoscaling sometimes causes the outage, and how to test for the shape of the load rather than the volume.
Most platforms that fall over at peak were never slow. They were fine on Monday, fine last month, fine on every dashboard anyone looked at. Then the window opened and the whole thing became unusable in about four minutes.
The reason is that the average is the wrong number, and it is the number everyone quotes.
A platform serving a steady trickle all year and a platform serving eleven quiet months followed by three days of everything can have the same monthly average and completely different failure behaviour. Averages describe the hours that were fine. They say nothing about the hours that decide whether you have a business.
Seasonal businesses live with this. Tax deadlines, renewal windows, results days, campaign launches, Black Friday. The system is comfortable for eleven months and falls over in the twelfth, which is the twelfth that pays for the other eleven.
Peak is not a bigger version of normal
The instinct is to treat peak as a scaling problem. Four times the traffic, four times the resources, done.
That instinct is wrong because latency does not rise in proportion to load. It rises slowly while there is slack, and then it does not.
Queueing behaviour is the reason. When a system is at half its capacity, a request that arrives rarely waits. As utilisation climbs, requests start arriving while previous ones are still being served, so they queue, and queueing time adds to service time. Past a certain point, small increases in arrival rate produce large increases in waiting. Somewhere above about eighty per cent utilisation the curve stops being gentle and turns into a wall.
The practical consequence is that a system running comfortably at forty per cent has far more than twice the headroom of one running at eighty. And nothing on a monthly average graph tells you which one you have.
This is also why the first sign of trouble is rarely gradual. Teams report that everything was fine and then everything was not. That is exactly what the curve predicts.
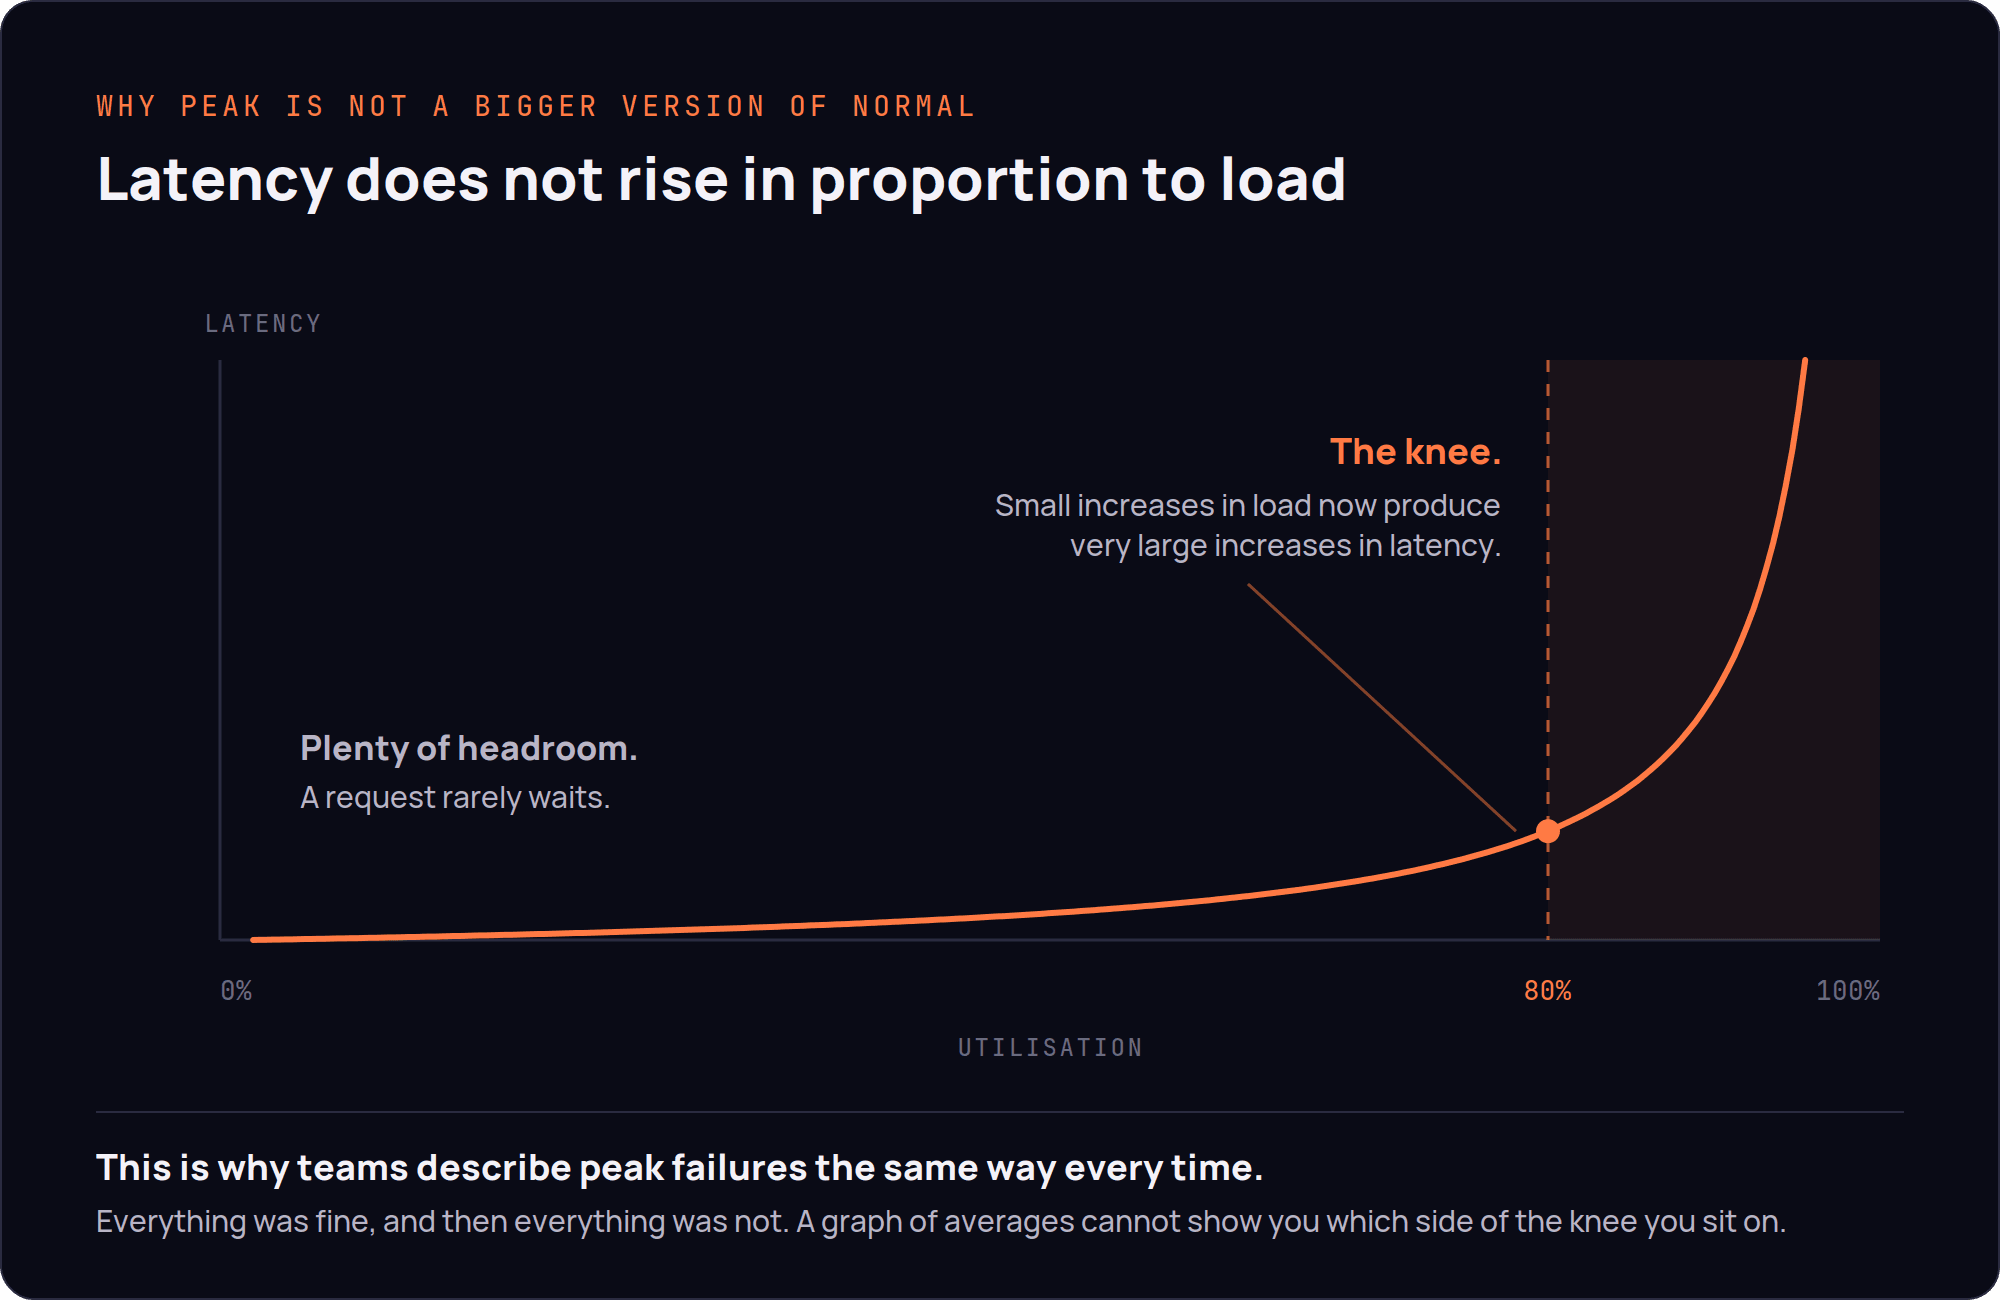
Latency against utilisation. The knee is where small increases in load stop being survivable.
What breaks first, and it is never the web servers
Web servers are the easiest thing to add and therefore almost never the constraint. What actually gives way, roughly in the order I see it:
The database connection pool. It is finite, it is shared, and it is the resource everything else waits behind. Once requests are queueing for a connection, every endpoint slows at once, which looks like the whole platform failing rather than one component.
A queue draining slower than it fills. At normal volume the workers keep up and depth sits near zero, so nobody watches it. At peak the arrival rate crosses the drain rate and depth grows without limit. Latency for anything behind that queue goes from seconds to hours.
A third party API with its own rate limit. Their limit, not your capacity. Payment providers, address lookups, mapping, identity checks. You cannot scale your way past someone else's quota, and at peak you will hit it precisely when it matters most.
A report that scans a whole table. Harmless at ten thousand rows and three users. Fatal at two million rows and three hundred. These are usually written years earlier by someone reasonable, and they sit quietly until the volume changes underneath them.
Cache expiry at the wrong moment. A popular cached item expires during the busiest hour and every request that would have hit the cache goes to the database simultaneously. The cache was the thing protecting you, and it steps aside for a second.
Notice that four of those five are a single shared resource. That matters for what comes next.
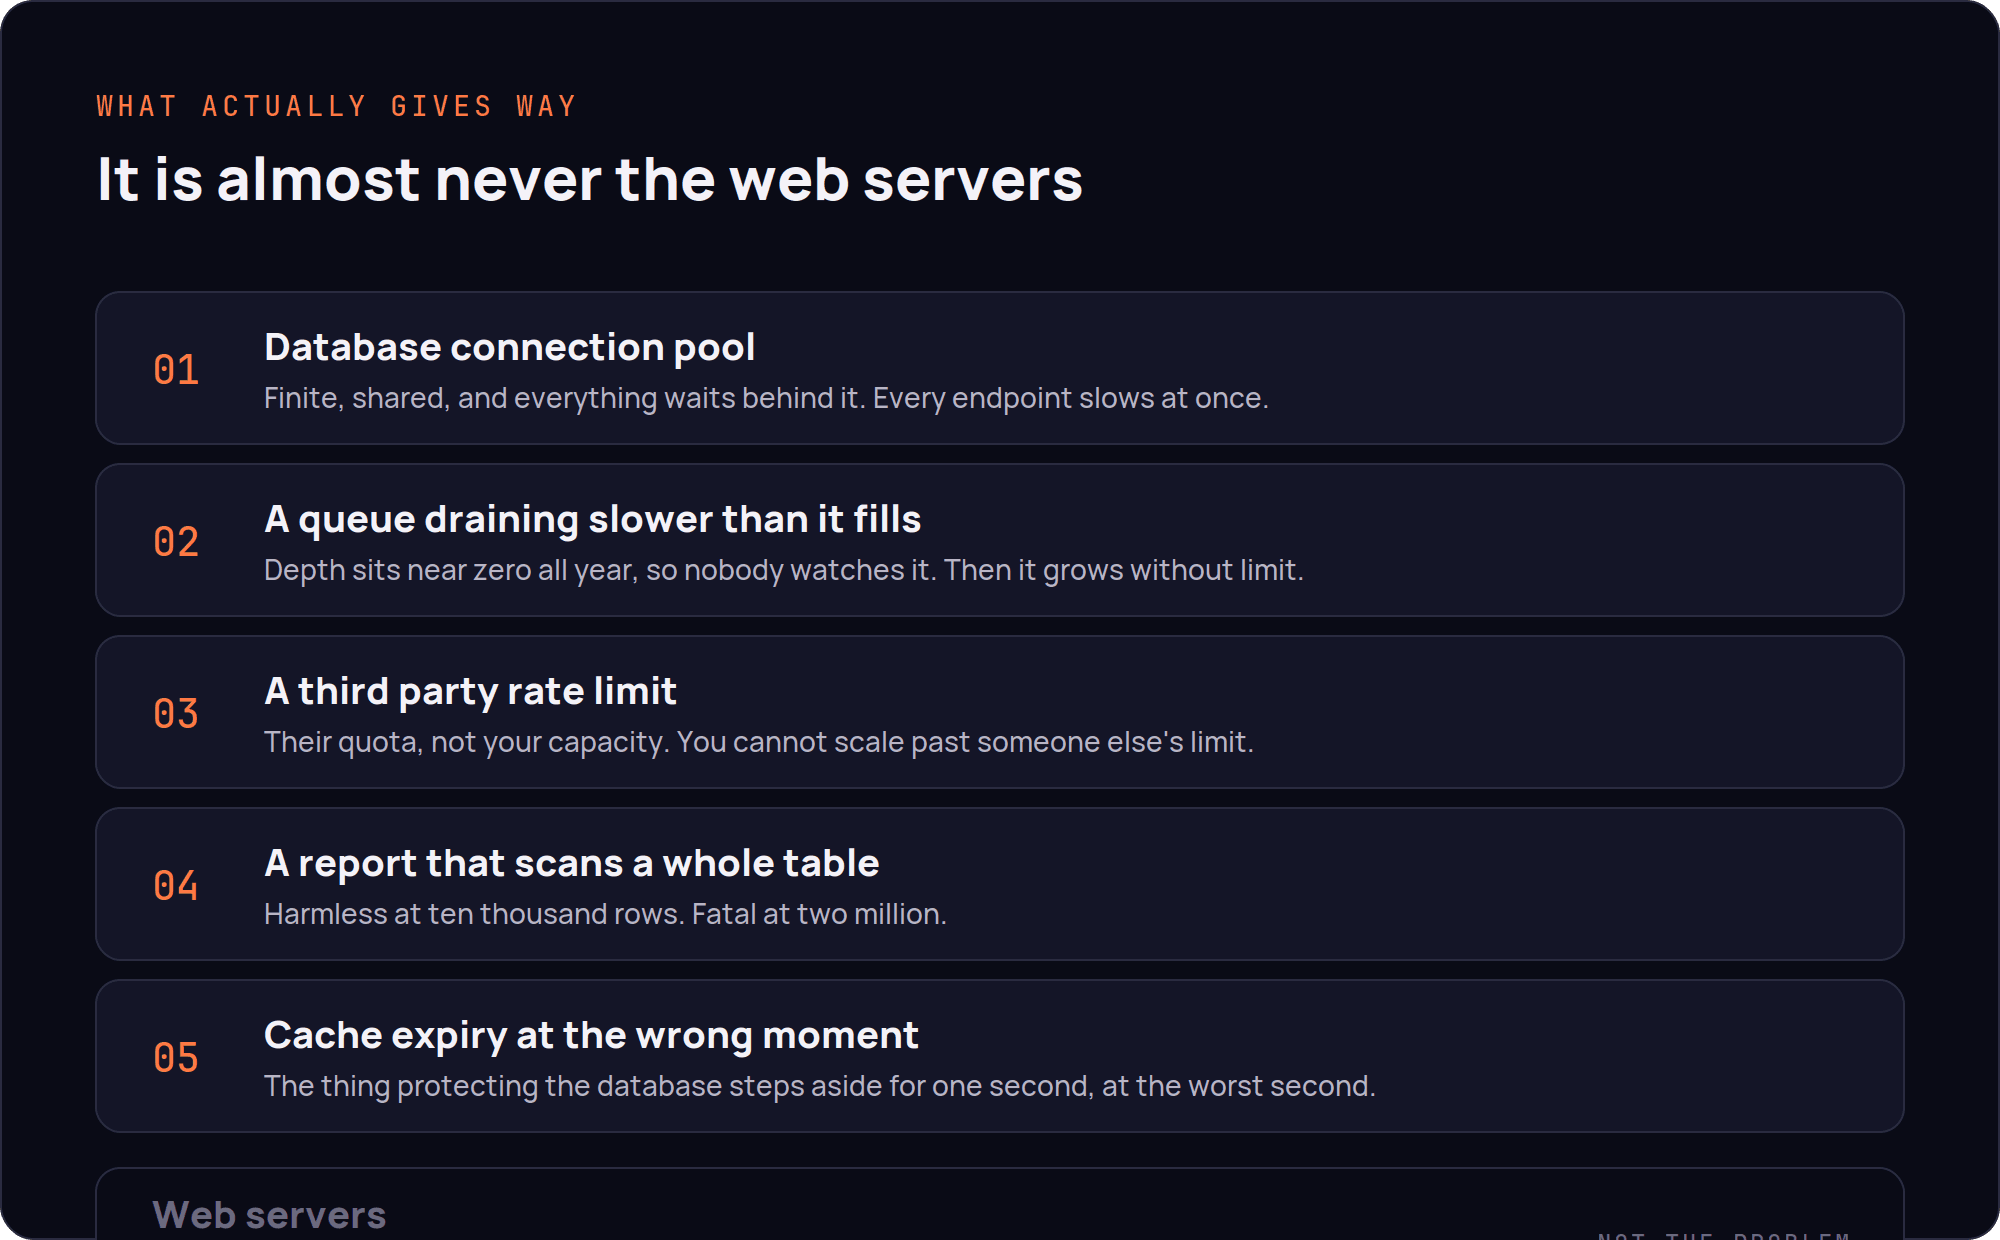
What actually gives way at peak, in the order it usually happens.
Autoscaling helps less than people expect, and sometimes hurts
Autoscaling is the standard answer and it solves a narrower problem than its reputation suggests.
It works when the bottleneck is stateless compute. It does nothing when the bottleneck is one database, one queue, or someone else's rate limit, which is usually the case.
Two specific problems are worth knowing about.
It is too slow for a real spike. Scaling reacts to a metric, then provisions, then boots, then warms up. That is minutes. A deadline spike is seconds. By the time capacity arrives the queues are already deep, and now you are recovering rather than coping.
It can be the trigger. Every new application instance opens its own pool of database connections. Scale the web tier from four instances to twenty and you have multiplied connection demand on a database that did not scale at all. I have watched an autoscaling event take a platform down: the web tier grew exactly as designed, the database hit its connection limit, and everything failed together. The system did the correct thing and the correct thing was fatal.
If you are going to autoscale, put a connection pooler in front of the database first, so the application tier can grow without the connection count growing with it.
The failure that does not clear when the traffic stops
This is the part that surprises people, and it is the most useful thing in this article.
You would expect that when the spike passes, the system recovers. Often it does not. It stays broken after the cause has gone.
There is a name for this. Bronson and colleagues at HotOS 2021 described it as metastable failure: a trigger pushes the system into a bad state, and a sustaining effect keeps it there even after the trigger is removed. Later empirical work found this pattern behind a large share of published outages at major software organisations, which matches what the failure feels like from the inside.
The usual sustaining effect is retries. A request times out. The client retries. The retry adds load to a system that is already saturated, so more requests time out, so more retries are issued. The system is now generating its own traffic, and the original spike has nothing to do with it any more. Traffic drops back to normal and the platform stays down.
Two conclusions follow, and they are not obvious.
You cannot wait it out. Every minute you spend hoping it recovers is a minute the feedback loop keeps running. Breaking the loop takes deliberate action: shed load, drain or purge the queue, disable the retrying client, or restart under reduced traffic.
The fix is the loop, not the trigger. Teams write the post-incident review about the spike, because the spike is visible. But there will be a different trigger next time and the same loop. What actually protects you is bounded retries with exponential backoff and jitter, a retry budget so clients cannot retry indefinitely, circuit breakers that fail fast when a dependency is unhealthy, and load shedding that returns a quick error rather than accepting work you cannot complete.
Rejecting a request in five milliseconds is kinder than accepting it and failing after thirty seconds, because the fast rejection does not consume the capacity that everyone else is waiting for.
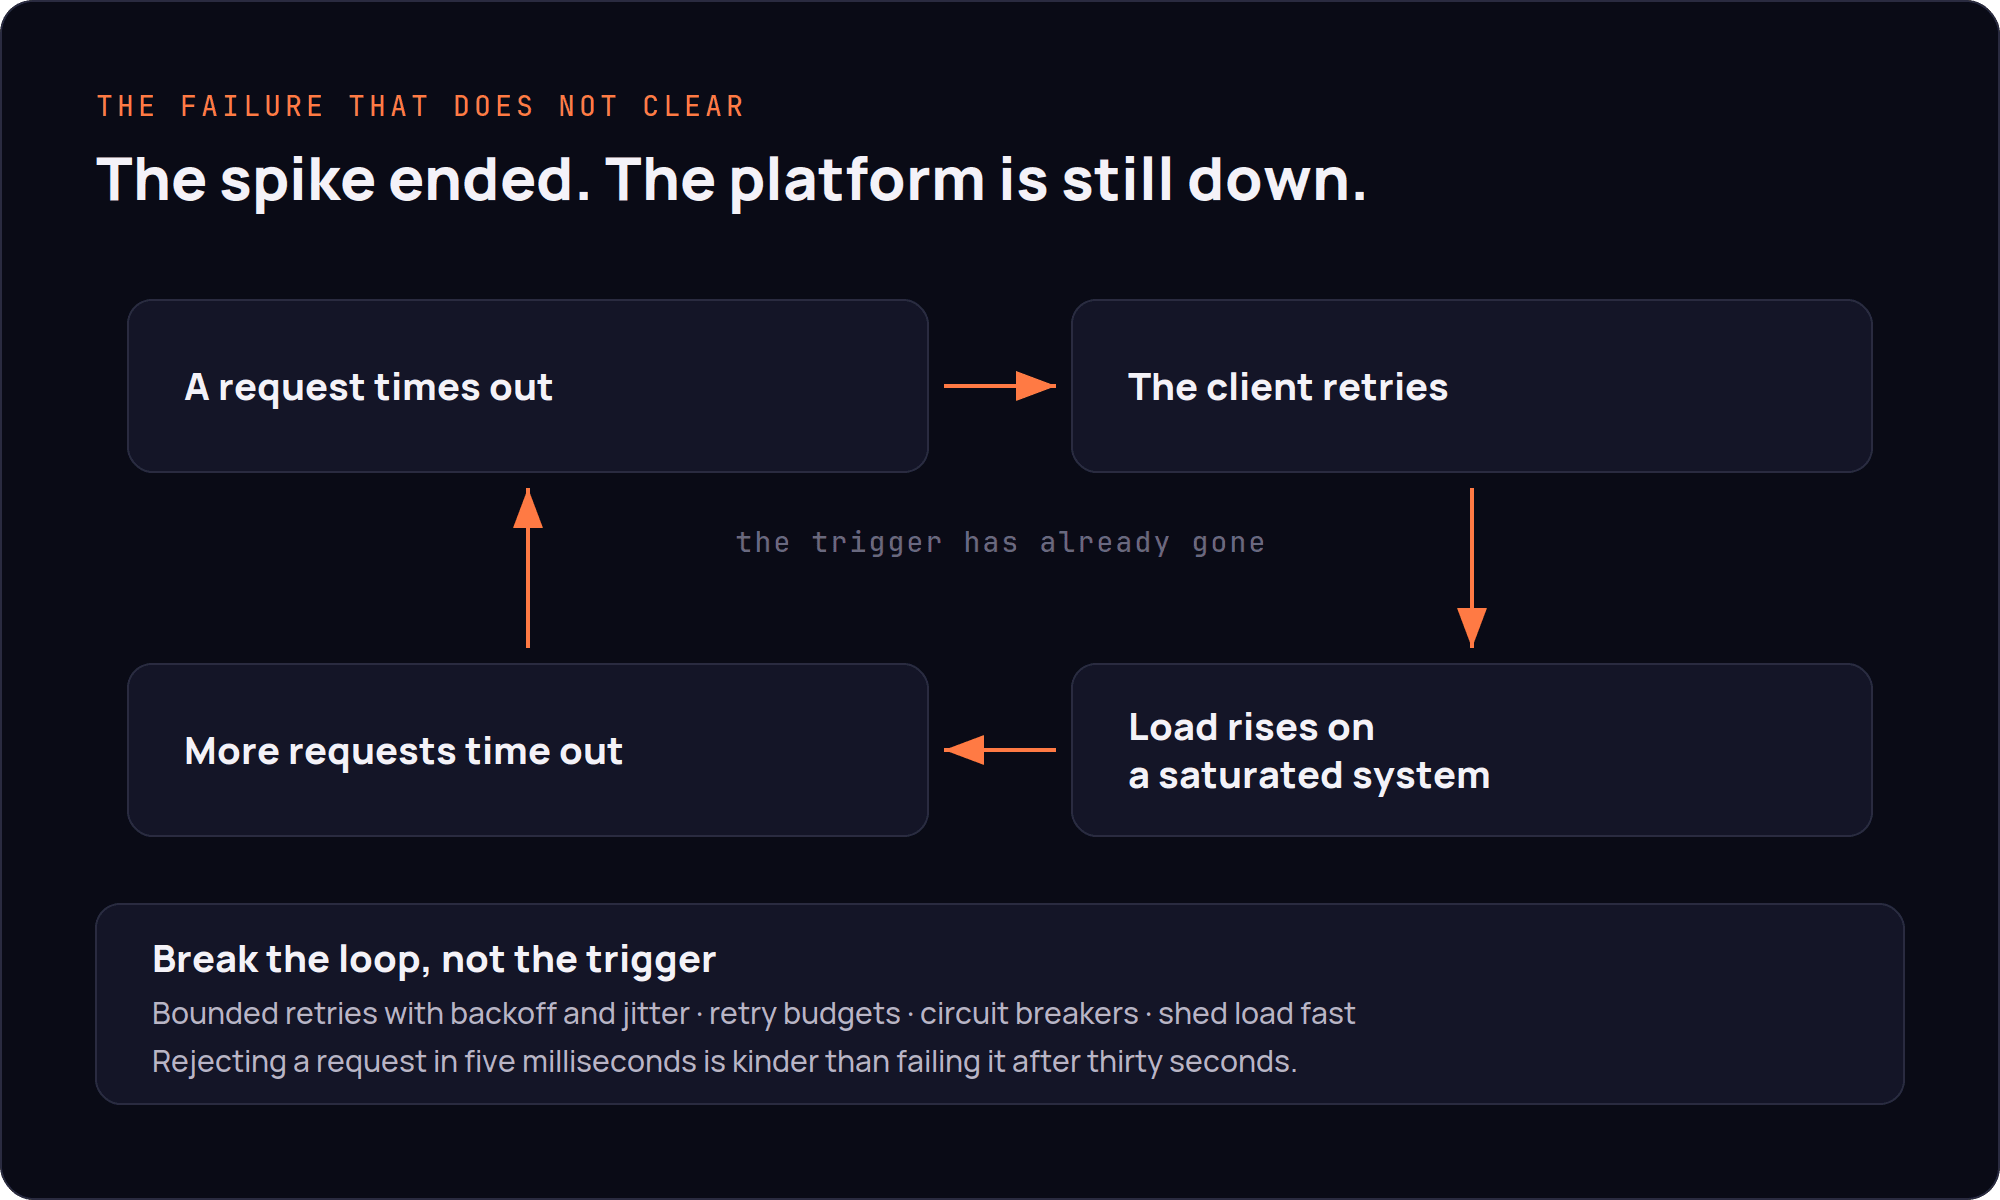
The retry loop keeps the system down after the trigger has gone.
Test at peak shape, not peak volume
Most load testing proves the wrong thing. Taking a day of traffic and spreading it evenly across an hour tells you the system can handle the volume. It does not tell you whether it can handle the shape.
Replay a real busy hour instead, from real access logs, at real concurrency, with the real distribution of endpoints. The distribution matters more than the total: peak traffic is not just more traffic, it is differently shaped, because everyone is doing the same thing at the same time.
Include the things that only coincide at peak. The nightly report that overlaps the window. Cold caches after a deployment. A backup that runs on schedule regardless.
Then find the knee deliberately. Ramp the load and watch where latency stops tracking linearly. That departure point is your real capacity. It will be lower than the number you eventually reach before errors start, and it is the number worth planning against.
Watch the leading indicators while you do it. Latency is a lagging signal, because by the time it moves the queue is already deep. Queue depth, connection pool utilisation and worker saturation move first.
What to build before the window opens
Know which single resource is your constraint. There is almost always one, and it is usually the database. Everything else is detail until you know that.
Then, in rough order of value: put a pooler in front of the database, bound your queues so they push back rather than growing without limit, precompute what you can so the expensive report becomes a stored result rather than a live scan, and add jitter to cache expiry so items do not all expire together.
Decide in advance what you will turn off. Not everything needs to work at peak. Recommendations, analytics, non-essential emails, the heavier search options: these can be disabled by a flag while the core path stays fast. Degrading deliberately is a far better outcome than degrading accidentally, and the decision is much easier to make in a quiet week than during the window.
Then rehearse it. A runbook nobody has executed is a document, not a plan.
The commercial version of this argument
For a seasonal business, downtime during the peak window is not proportional to its duration. It is not two per cent of the year's revenue lost because it was two per cent of the year. Those customers were transacting in that window because that is the only window, and most of them do not come back later.
That asymmetry is what justifies designing for the spike rather than scaling into it. The engineering effort looks disproportionate against average load, because it is. It is not sized against the average. It is sized against the three days that matter.
If your platform is comfortable most of the year and frightening for one week of it, the question to ask is not how much capacity you need. It is which single resource runs out first, and what your system does in the minute after it does.